What Is Dividend Growth Investing?

With an understanding of DGI as a portfolio strategy, you can up your long-term investing and retirement planning game.
Our guide to dividend growth investing illustrates how it can generate impressive investment returns.
-

-

- 8 min read
Dividend growth investing (DGI) is about much more than buying and holding stocks that pay dividends – it’s about buying and holding stock in well-established companies that pay reliable, consistent, and growing dividends.
With an understanding of DGI as a portfolio strategy, you can up your long-term investing and retirement planning game. Our guide to dividend growth investing illustrates how it can generate impressive investment returns.
Dividends: Reliable, Consistent, Growing
When you seek dividend stocks to include as part of a dividend growth investing approach, you must look for companies with a solid track record of not only paying, but increasing their dividend payments.
Not all companies that pay dividends are equal. Some dividends are stronger than others. There are a lot of complicated factors which determine payout quality, such as dividend yield and payout ratio. However, one of the most important factors is also the most straightforward: how frequently and consistently a company increases its dividend payment.
Ideally, you want to own companies that increase their dividends annually. Dividend growth investors pay close attention to this metric, going so far as to classify companies on the basis of these yearly dividend increases.
For example, a dividend achiever is a company that has increased its dividend payment every year for at least ten years in a row. A dividend aristocrat is a company that has done so for at least 25 consecutive years. (For a comprehensive list of the requirements for dividend aristocrat status, see our guide that focuses on dividend increase classifications).
There’s even an ETF (exchange-traded fund) that tracks the performance of the dividend aristocrats. Yet more prestigious of a category is that of the dividend kings — these have a 50 year or longer track record of annual dividend increases, while dividend achievers have done likewise for a minimum of 10 years in a row.
Dividend Growth Examples
Here’s an example what a dividend increase looks like, using Procter & Gamble’s (PG) recent dividend payment history:
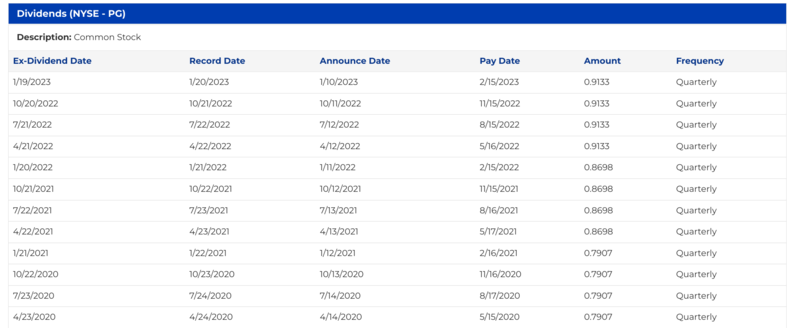
As you can see, as of April 2023, P&G pays a quarterly dividend of $0.9133 per share for an annual dividend of $3.65. In April 2023, P&G announced a dividend increase, bringing its quarterly payment to $0.9407, or $3.76 annually.
Based on this data, we see that P&G increased its dividend by 5.0% in 2022. With the April 2023 news, P&G’s dividend increases by 3.0% in 2023. Dividend growth investors often use the frequency and consistency of dividend increases as well as the amount of the increase to measure the attractiveness of a dividend. Over 20 years, P&G has increased its dividend by an average of 7.89% annually. This is a long and strong track record of dividend payment and increase activity.
Dividend growth simply means a company’s dividend gets larger over time, most often on an annual basis.
The Power Of Dividend Growth Investing
Now, let’s consider the power of these increases by looking at how much money an investment can grow with and without a dividend payment.
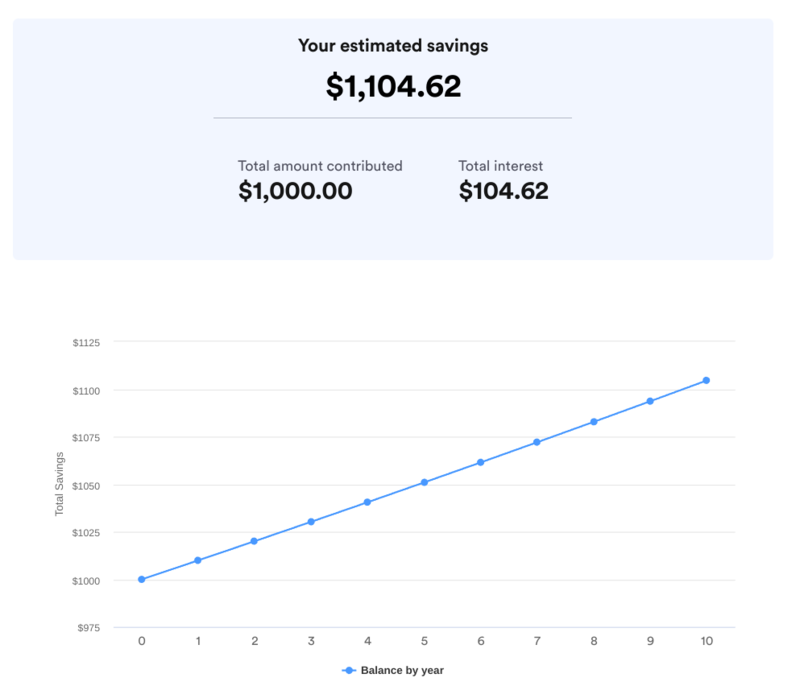
But first, to develop an understanding of how this growth happens, let’s look at how interest compounds in a basic savings account.
Deposit $1,000 in a basic savings account today and you will start earning interest at whatever interest rate your bank offers. If you earn $1.00 in interest on that $1,000 in month one, your principal balance becomes $1,001. Therefore, in month two you’re earning interest in $1,001. All else equal (such as the interest rate remains the same), you should earn more than $1.00 in interest in month two. Let’s call it $1.10. This means your principal balance becomes $1,002.10 and, in month three, you earn interest on that principal balance.
Over time, your initial $1,000 savings account deposit can look something like this:
Compounding with dividend stocks looks something like this, but, in practice, it’s much more powerful, particularly when dealing with dividend growth stocks — that is, stocks that increase their dividend payments consistently over time.
Consider this hypothetical example of how it can look.
If you own 100 shares of a $50 stock that appreciates 10% annually with an annual dividend yield of 4% and average annual dividend increases of 5%, you’ll wind up with $16,648 after 10 years, assuming you reinvested all the dividends you received into new shares of the stock and paid a 15% dividend tax.
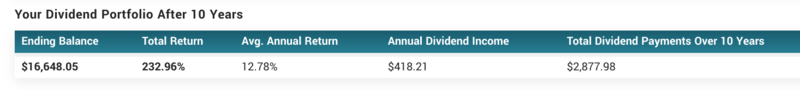
You can see the power of dividend growth and reinvestment (basically compounding) when you look at the year-by-year breakdown.
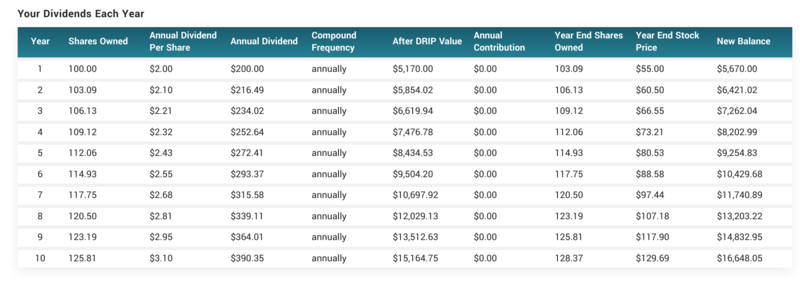
By reinvesting dividends, you increase the number of shares you own over time. In tandem with the company’s annual dividend increases, you earn a larger dividend payment each quarter because the dividend reinvestment increases your position size. And this all happens without even making additional contributions (other than the dividend reinvestment) into the stock.
If we take away the dividend component and calculate growth on 100 shares of a $50 stock that appreciates 10% annually over 10 years, you end up with a less impressive $12,969. That’s a total return of 159% compared to the 233% total return with the dividend stock.
Keep everything else constant and up the time frame to 30 years, and your returns look like this:
- Non-dividend stock: $87,247 after 30 years for a total return of 1,655%, or 10% annually.
- Dividend stock: $144,799 after 30 years for a total return of 2,796%, or 11.9% annually.
Dividend Growth Rate
A key measure of a dividend’s strength is the rate at which a company increases its annual dividend. Without a dividend increase, a company ceases to be a dividend growth stock.
If it pays a static dividend (as in, it skipped one or more consecutive annual increases), take growth out of its name and simply call it a dividend stock. Therefore, as you consider dividend growth as part of your portfolio it’s important to assess by how much a company tends to increase its dividend every year.
All else equal, companies with the biggest annual dividend increases over time amplify this compounding effect. When researching a dividend stock, you’ll often see a metric showing the average annual dividend growth, measured using percentages and typically over 1- or 5-year periods.
For example, if a company paid an $2.00 annual dividend in 2021 and increased that payment $0.25 to $2.25 in 2022, it increased its dividend by 12.5% over a one-year period.
While other factors such as stock price performance and payout ratio can come into play, generally speaking, the larger the annual dividend increase, the more prolific the dividend growth stock.
Using a company everyone has heard of as a real-life example, Target (TGT) has increased its dividend every year for 54 years, as of April 2023, making it a dividend aristocrat.
However, it’s the rate at which Target increases its dividend that makes it even more impressive. Over the last five years, Target has increased its payout by an annual average of 11.0%. Between 2022 and 2023, Target increased its annual dividend by 20% from $3.60 to $4.32.
Conclusion
In saving and investing, compounding growth can produce powerful effects. It’s a wealth builder.
As our guide shows, dividend growth investing can be one of the most prolific ways to realize the benefits of compounding by letting income you earn (interest with a savings account, dividends with dividend stocks) increase your principal, and, subsequently, increase your returns over time.
This is the primary reason why seasoned investors don’t settle for any old dividend stock. They only buy dividend stocks with a formidable track record of increasing their dividends, or stocks that have shown they have the potential to consistently increase dividends going forward.
FAQs
What is the ETF that owns dividend aristocrats called?
The most popular ETF that tracks the S&P 500 Dividend Aristocrats Index is the ProShares S&P 500 Dividend Aristocrats ETF (NOBL).
Are there other ETFs that only own dividend stocks, even if they’re not Aristocrats?
Yes, there are too many to name. We provide examples here and an explanation of dividend ETFs here.
Does this mean I should only invest in stocks that pay dividends?
Absolutely not. Aim to keep a diversified portfolio. One way to diversify is to own dividend and non-dividend paying stocks. Oftentimes a stock that doesn’t pay a dividend returns more than a stock that pays a dividend because of superior stock price appreciation. We discuss the difference and balance between growth and income stocks here and here.
Which stock has the longest dividend increase streak?
As of April 2023, American States Water (AWR) is the leader, having increased its dividend every year for 68 consecutive years. There’s a website dedicated to keeping track of dividend aristocrats that will actually let you download a list of the current names for free.
Is it better to invest in individual dividend stocks or dividend ETFs?
This depends on several factors, particularly your comfort level with investing and your diversification goals. An ETF can provide access to a broad array of stocks in different sectors and at different stages of growth. While not impossible, it’s more difficult to accomplish by investing in individual stocks on your own.
What is an ETF?
An ETF is a lot like a mutual fund. However, unlike a mutual fund which typically only completes buy and sell orders when the stock market closes each day, you can trade ETFs any time, just as you can with stocks. Like mutual funds, ETFs own a basket of stocks that either track a broad or specific market index or invest on the basis of a theme, such as location, sector, or investing goals and styles.